Race results
Importing your race history
Cursa connects to RunSignUp — the largest US race registration platform — and searches for results by your name. Import your official race history in about 30 seconds, going back as far as the records exist.
-
1
Go to Me → Race Results → Find My Results
The search screen opens with your name pre-filled from your profile. Edit it if your race registration name differs.
-
2
Tap Search
Cursa queries RunSignUp for all results matching your first and last name. Results typically appear within a few seconds.
-
3
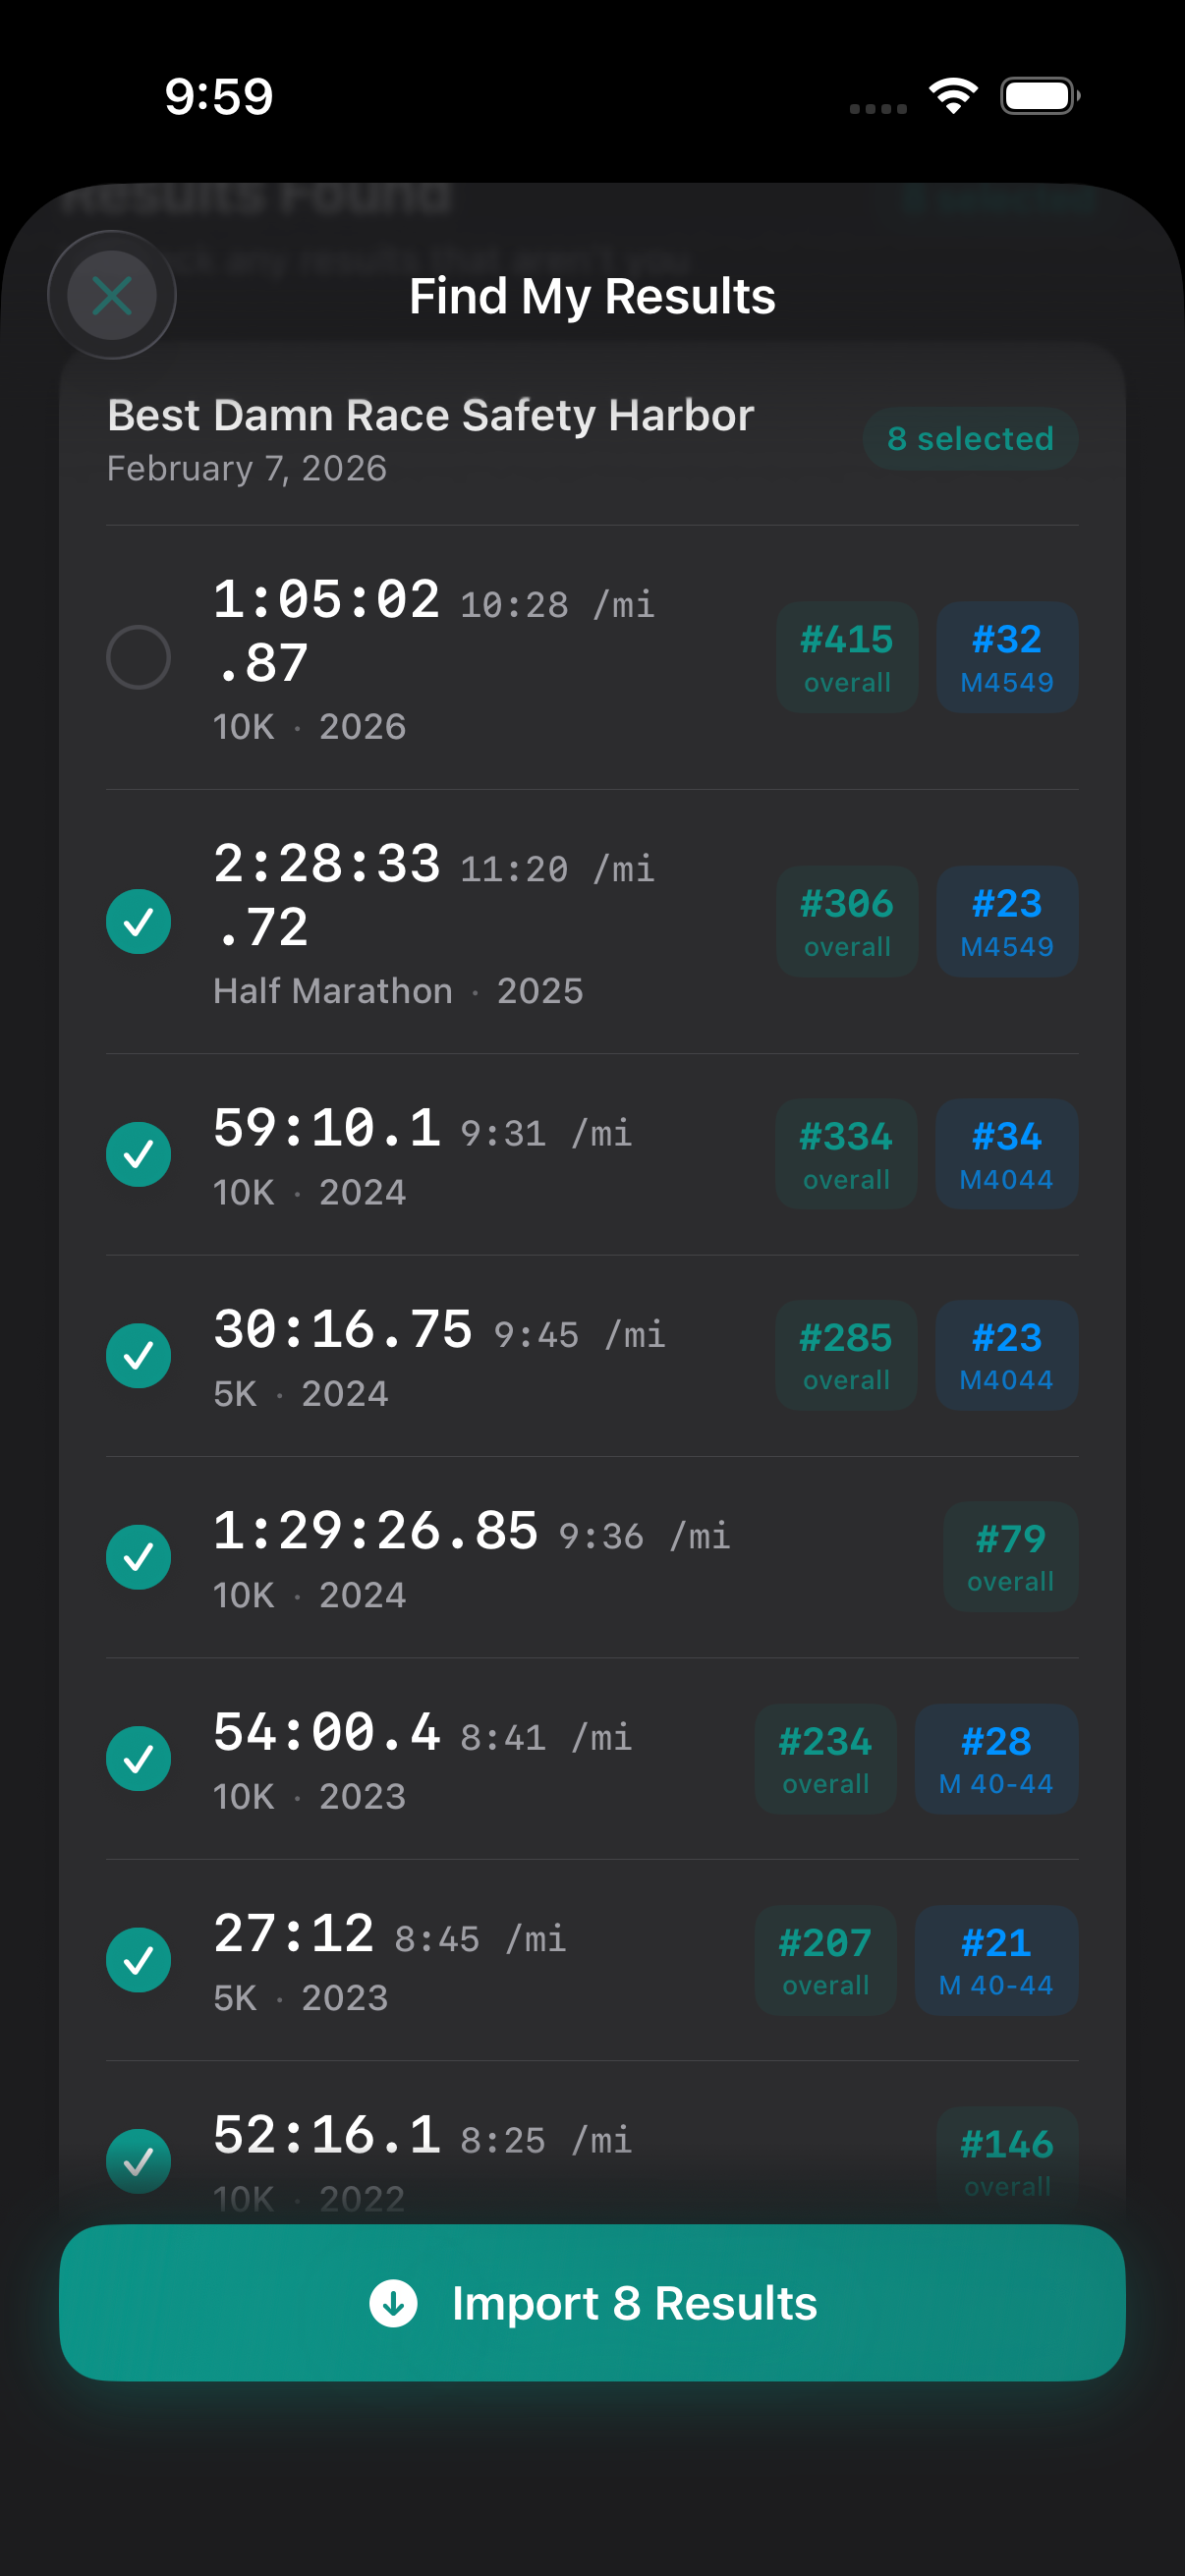
Review the matches
If you have a common name, you may see results from other runners with the same name. Deselect anything that isn't yours. Each result shows distance, year, chip time, pace, and your overall and age-group placing. The race name appears in the header — all rows in a search are results for the same race series, which can span multiple years.
-
4
Tap Import N Results
The button label shows the exact count of results you have selected — "Import 8 Results", for example. Confirmed results are saved to your Race Results list. Cursa then checks each one for personal records — any official time that beats your tracked-run PRs is updated immediately.
Race results list
Browsing your results
The Race Results screen groups and sorts your results in several ways. Official results imported from RunSignUp are marked with a verified badge.
Group by date
The default view. Most recent races at the top. Great for seeing your racing history as a timeline.
Group by race
All results from the same race series grouped together. Useful if you run the same race annually and want to compare year-over-year.
Group by distance
All your 5K results together, all your half marathon results together, and so on. The fastest in each group is highlighted.
Personal records
Automatic PR tracking
Cursa detects personal records across five standard distances — and it doesn't require you to race them officially. A 10K PR can be detected inside a half marathon run because Cursa analyses the fastest contiguous segment of every run.
How detection works
After every completed run, Cursa scans the cumulative split data to find the fastest contiguous segment for each standard distance. If any segment is faster than the current PR for that distance, a new PR record is written and a notification fires.
Official results take precedence
If an imported race result has a faster chip time than your tracked-run PR for the same distance, the official time becomes the record. Segment-extracted PRs (detected mid-run from cumulative split data) carry a from longer run badge so you know the provenance. PRs from imported official race results are saved alongside tracked-run PRs without a separate badge.
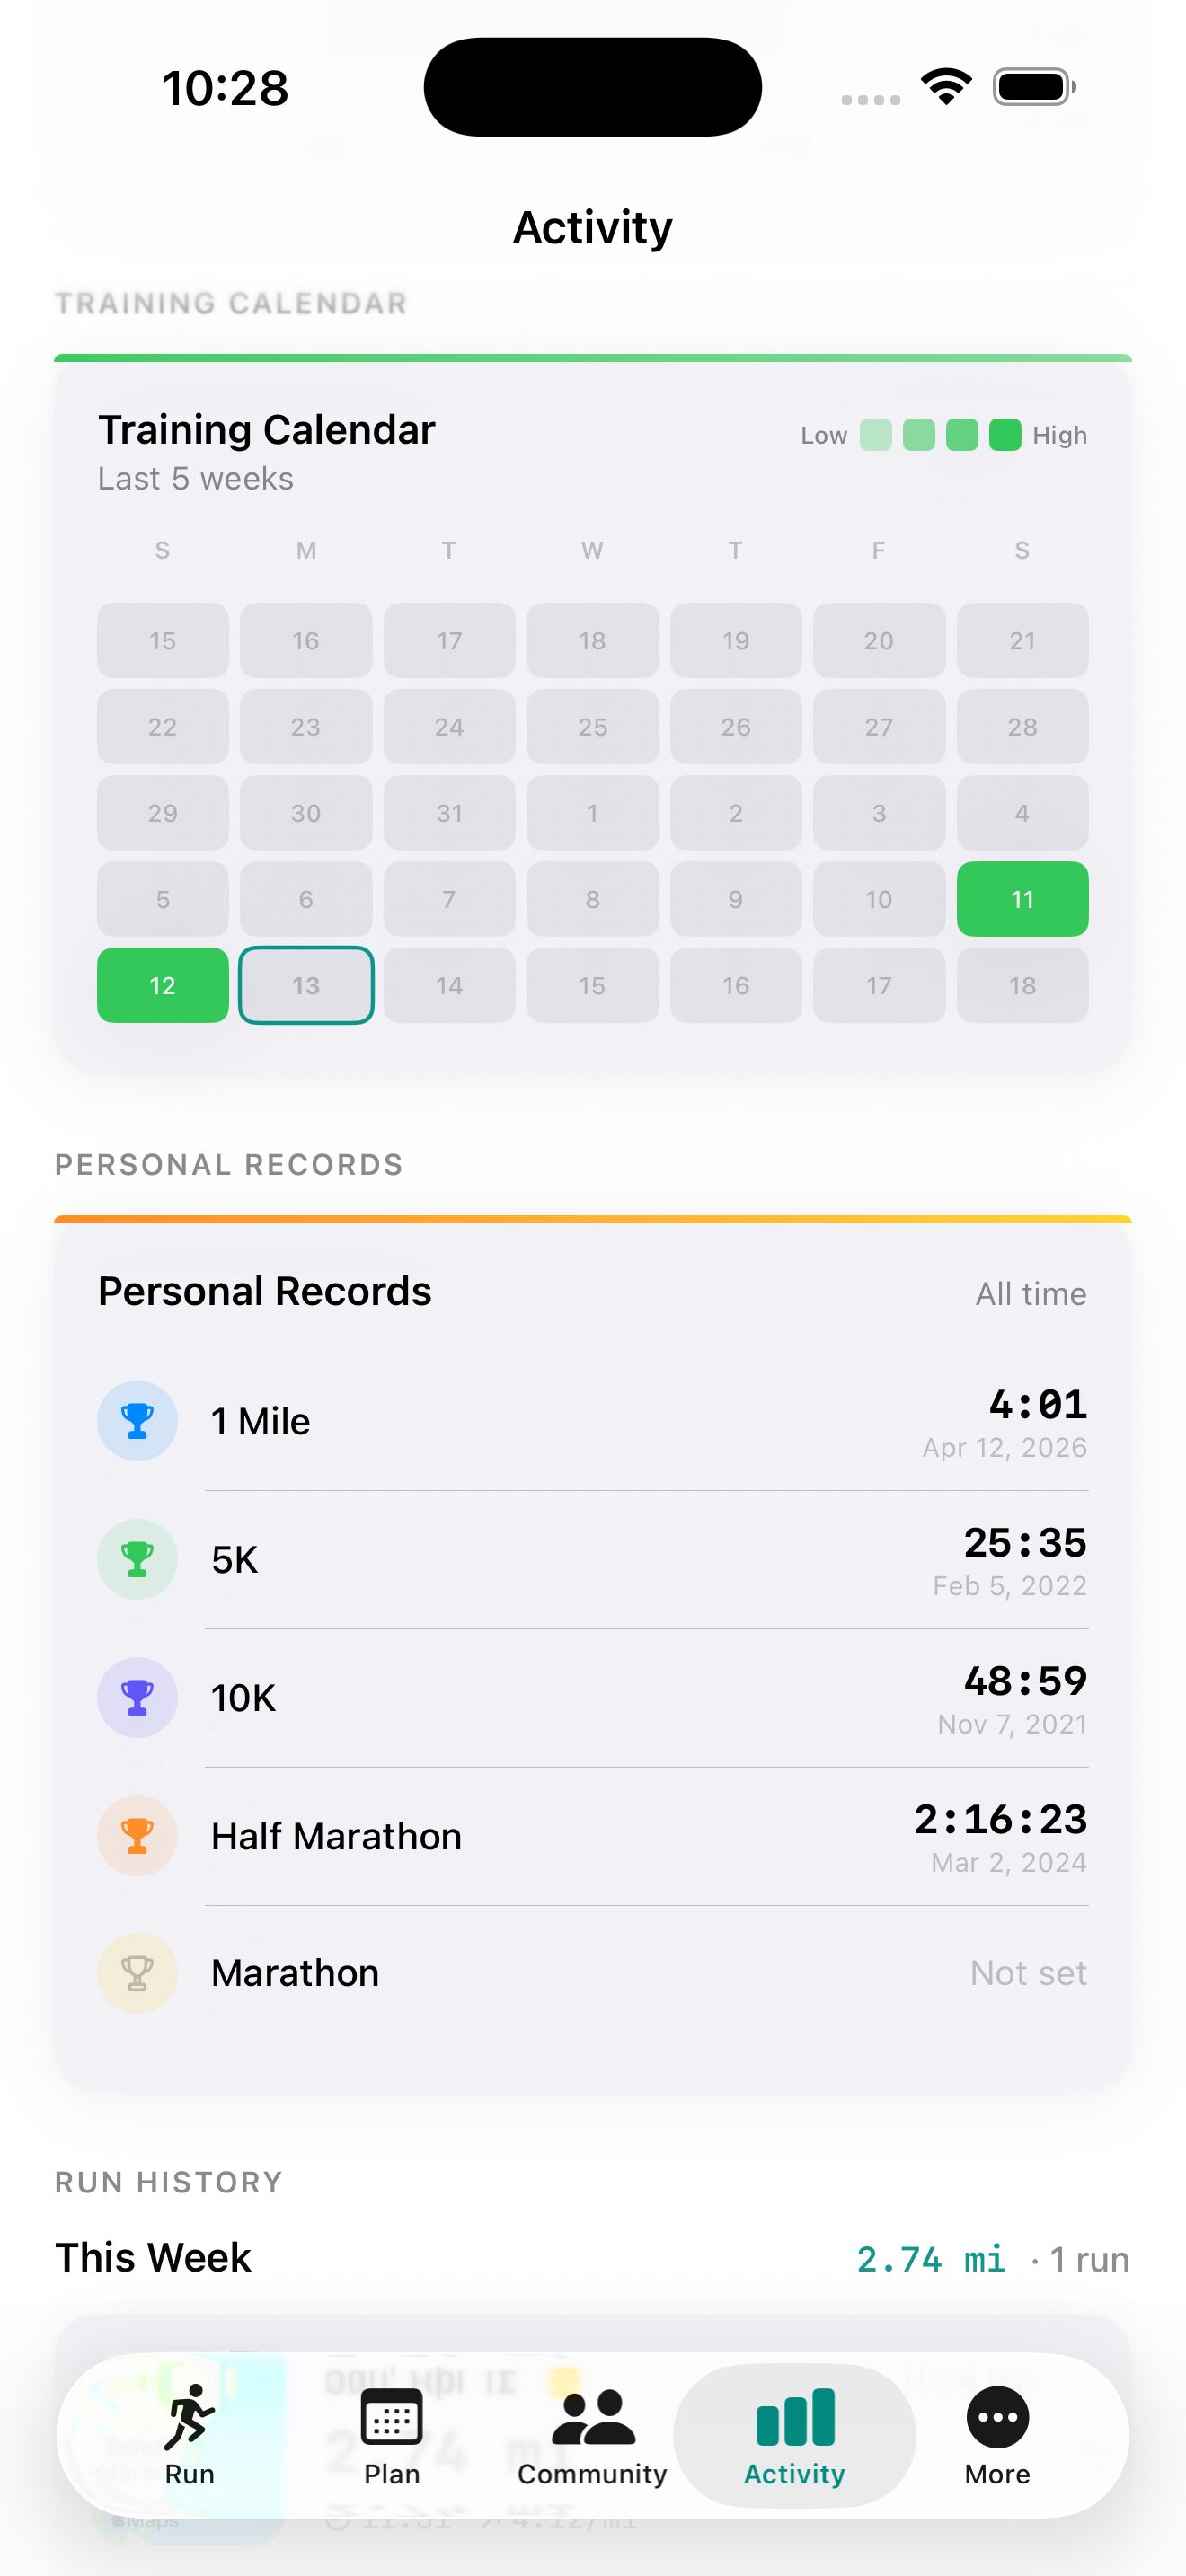
All Time tab
The fastest time ever for each distance, with the date it was set. A crown icon marks the cards where you have a personal record.
Year tab
Labelled with the current year (e.g. 2026). Shows your best times since January 1. Each year-to-date PR card carries a small THIS YEAR badge so you can tell at a glance which scope you're viewing.
Shoe tracking
Honest mileage on every pair
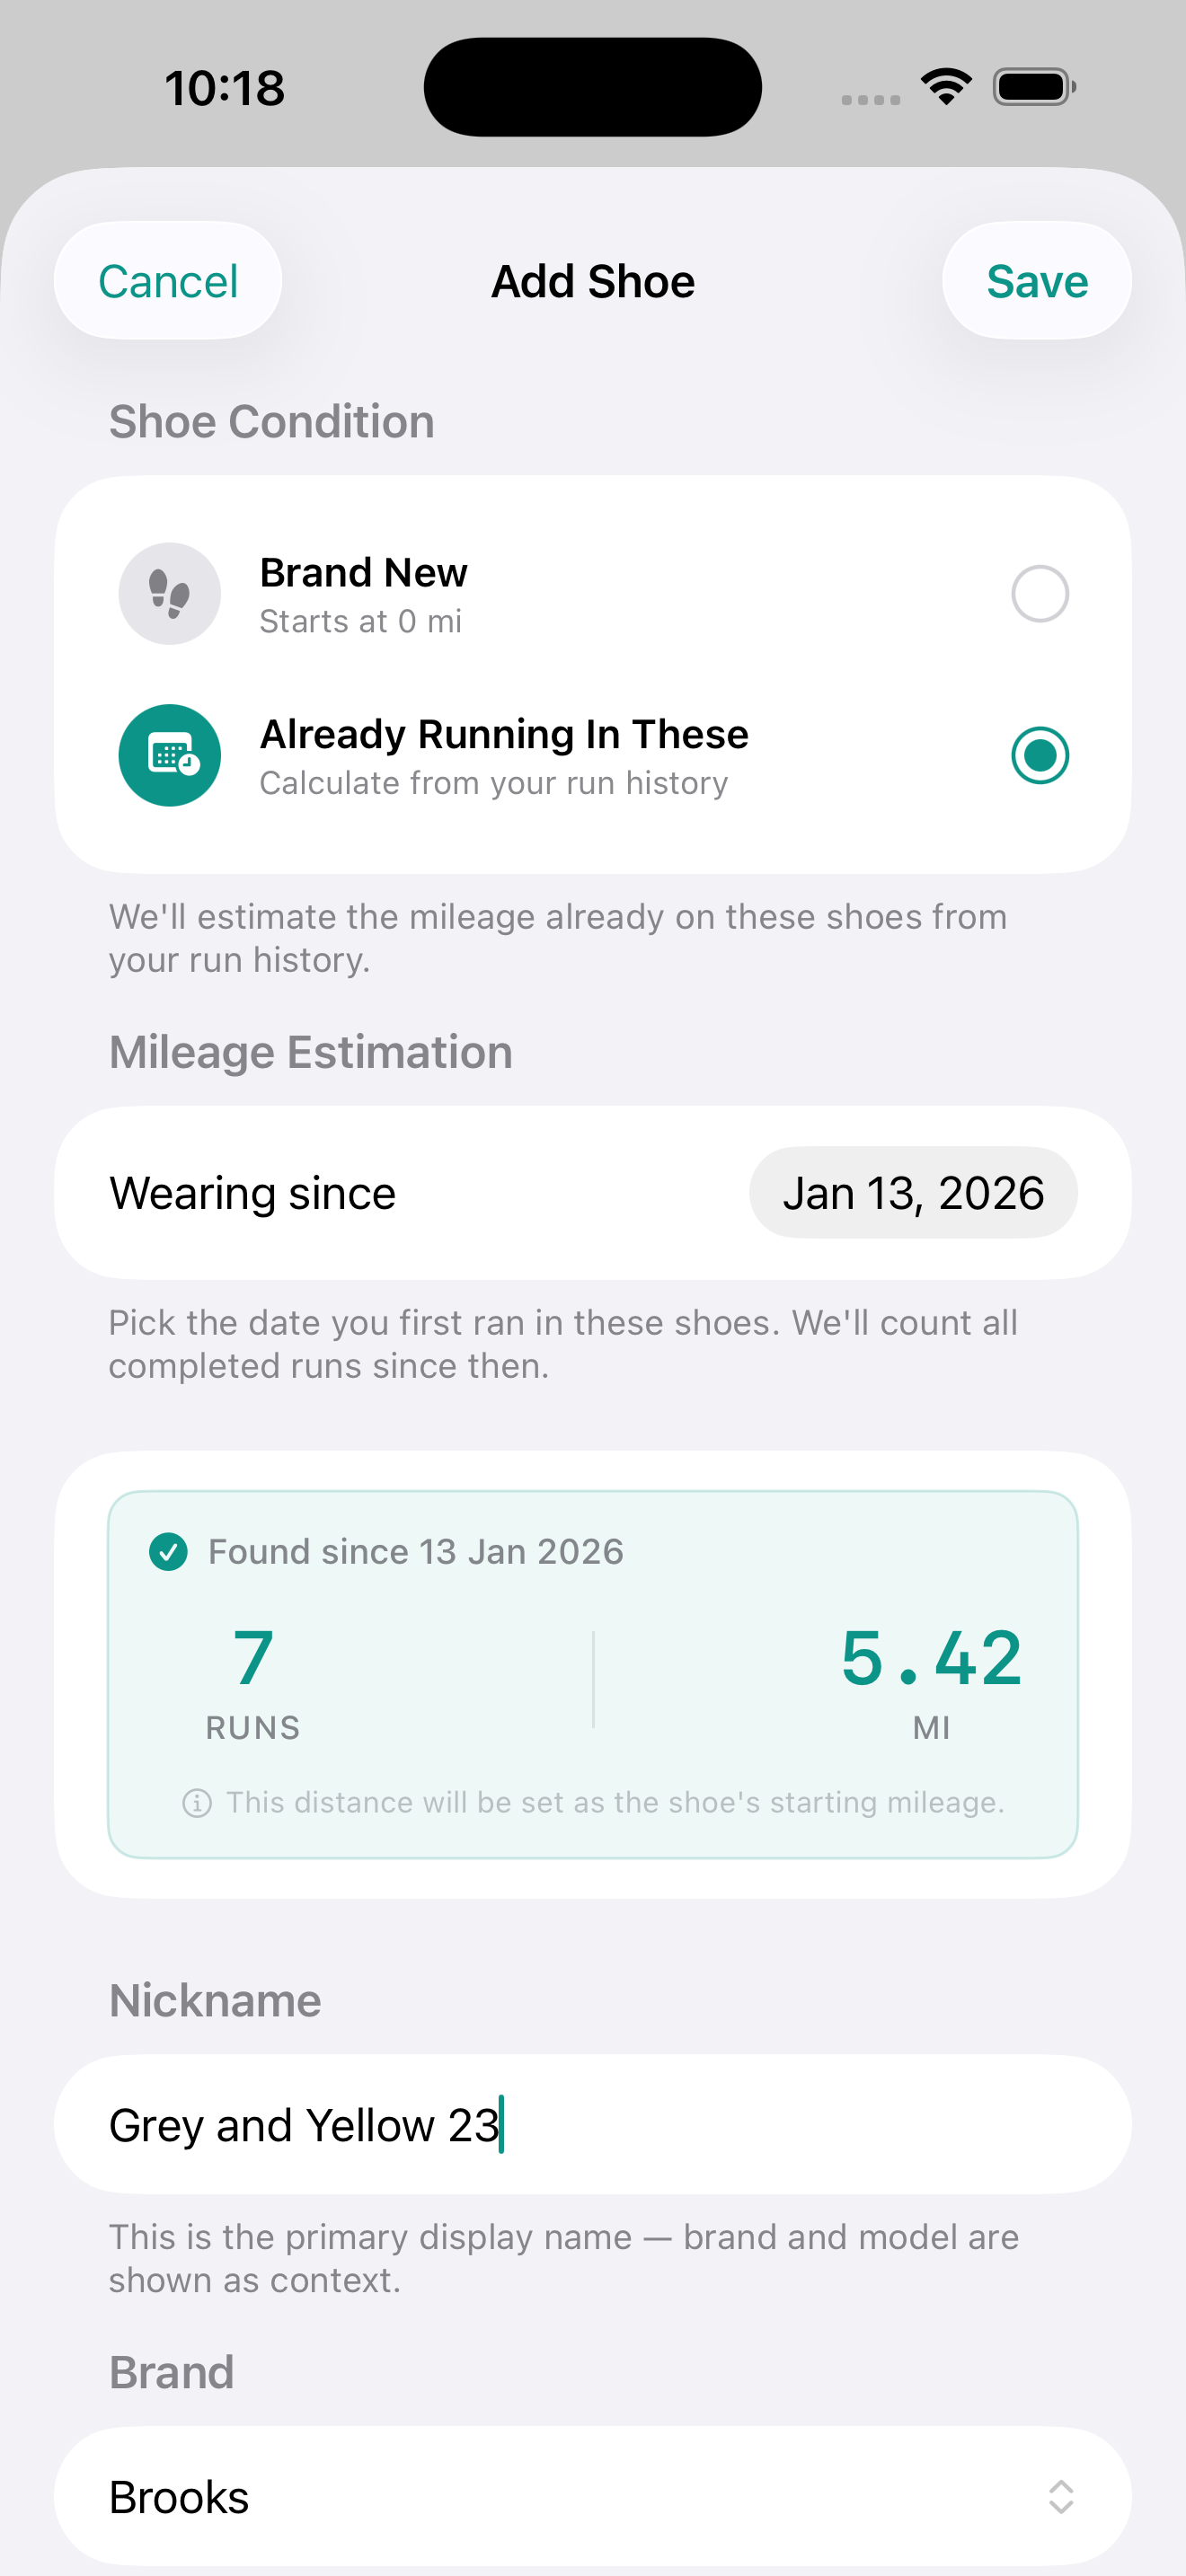
Cursa goes further than Strava and Garmin Connect on shoe tracking: it reads your Apple Health history when you add a shoe so the mileage counter starts accurately — not from zero, and not from a number you have to estimate.
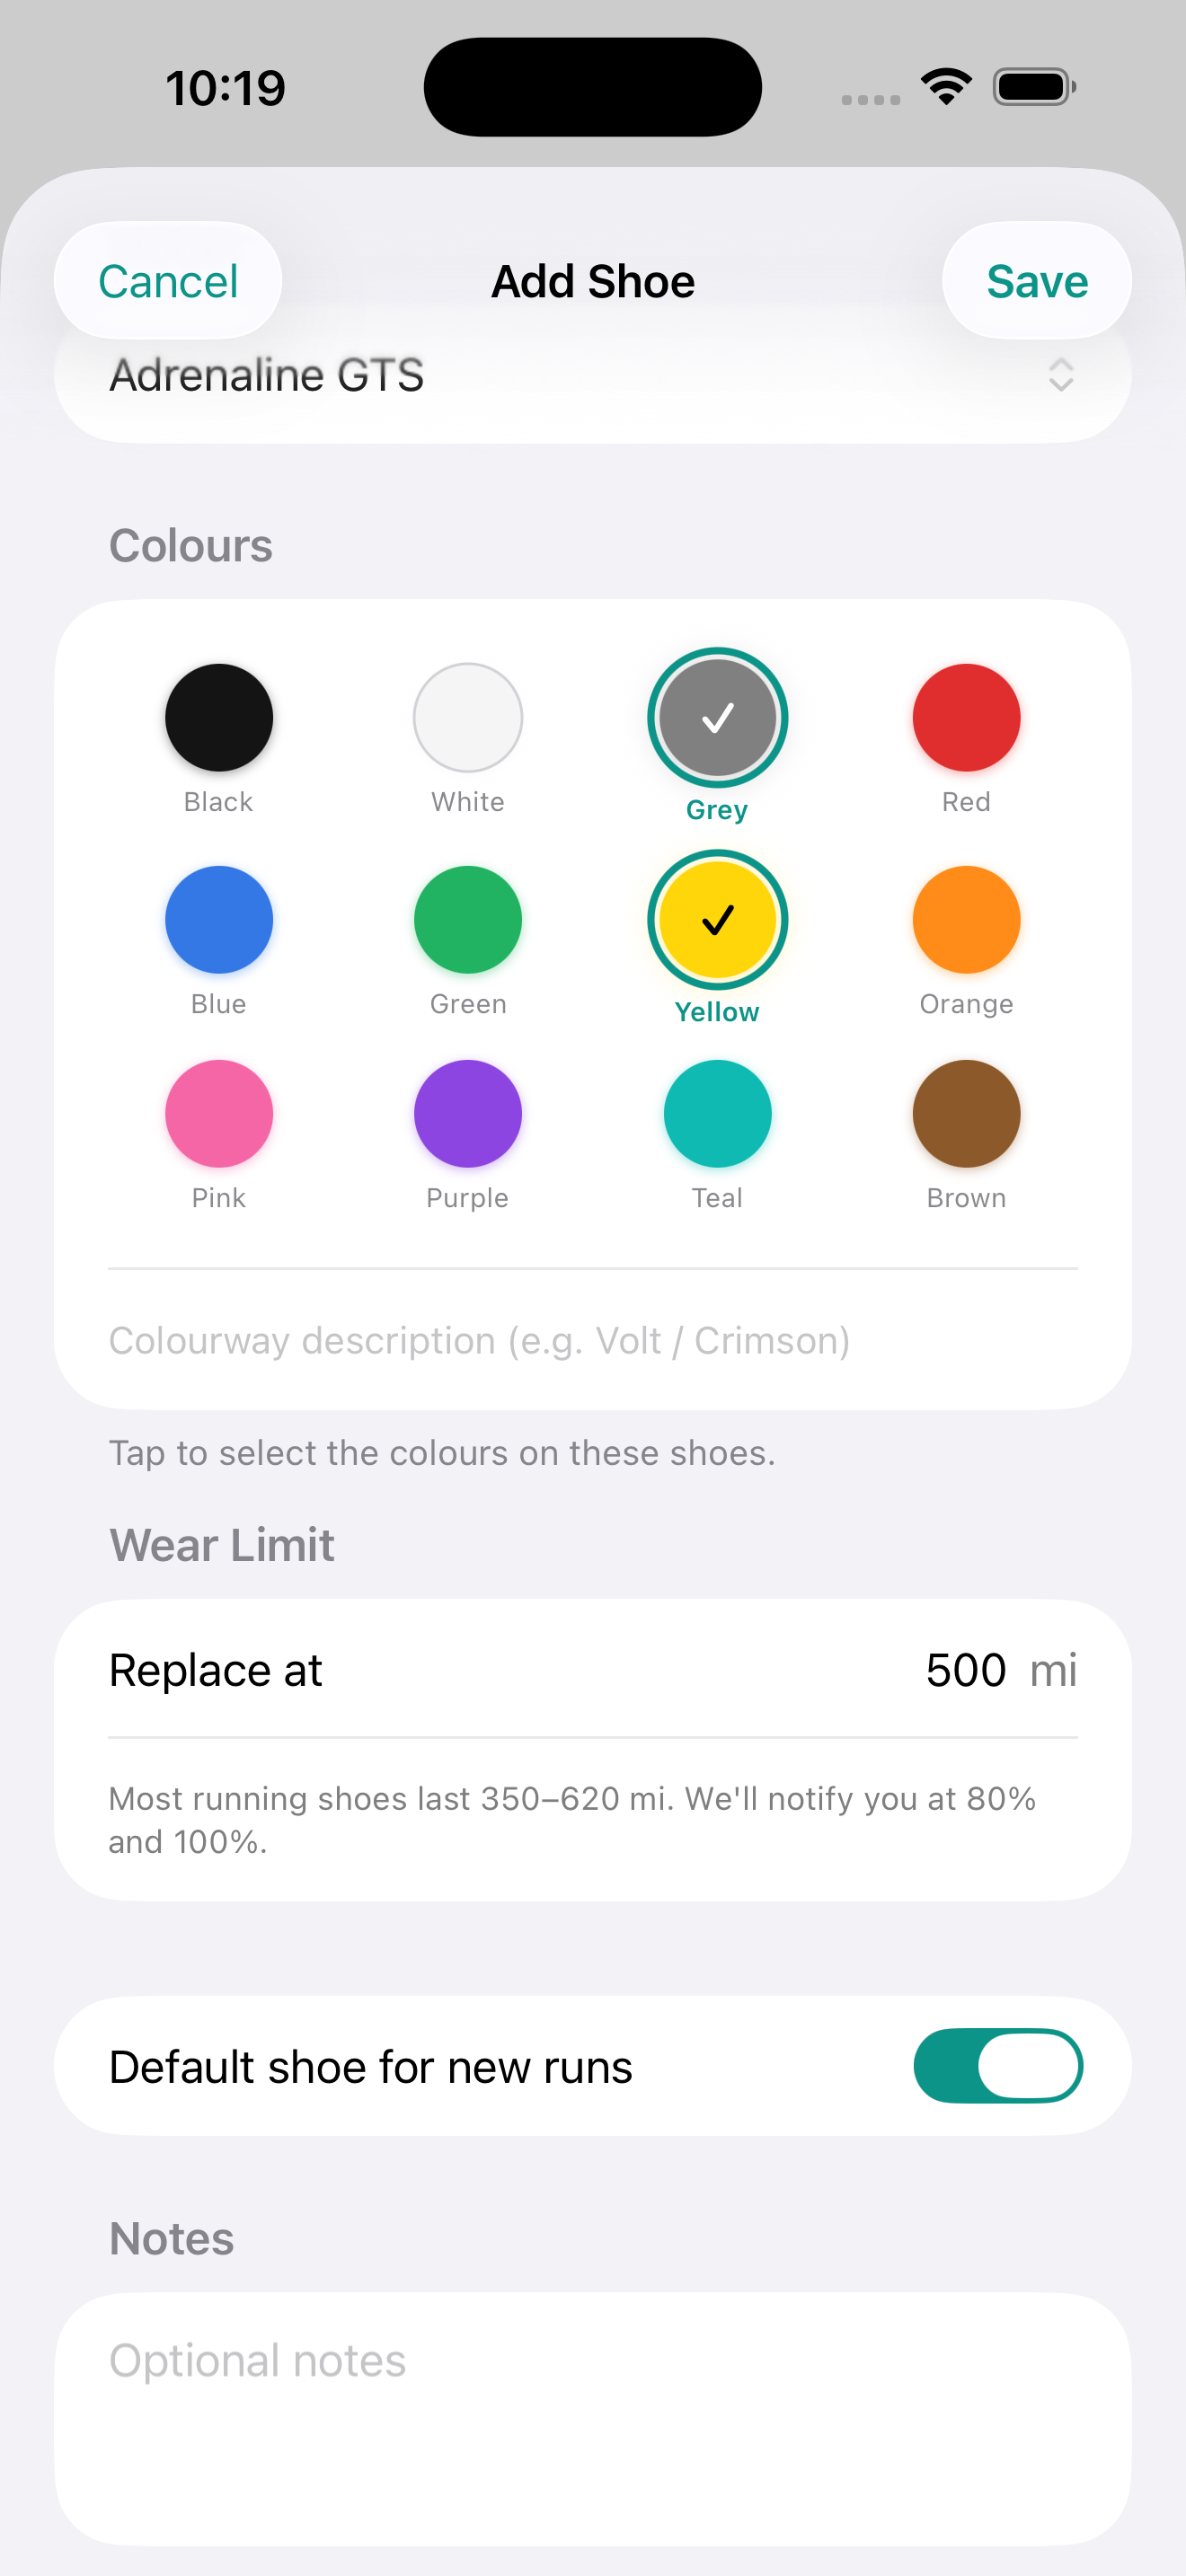
When you tell Cursa the date you first ran in a shoe, it scans Apple Health for every run since that date and shows you the total before you even save — 7 runs, 5.42 mi in the example below. That distance becomes the shoe's starting baseline automatically. Set your replacement threshold (default 500 mi), pick a colourway so you can tell your pairs apart at a glance, and you're done.
-
1
Go to Me → Shoes → + (top right)
The Add Shoe sheet opens with fields for brand, model, nickname, and colourway.
-
2
Set the start date
The month and year you started running in this shoe — not today's date unless you just bought them. This is the key field that unlocks backfilling.
-
3
Cursa backfills from Apple Health
After you save, Cursa reads all running workouts in Apple Health from the start date forward and sums the distance. This becomes the shoe's pre-Cursa baseline. If you have two years of HealthKit runs, all that mileage is accounted for.
-
4
Future runs assign automatically
Every run you complete in Cursa is assigned to your default shoe. No tagging required. If you rotate between multiple pairs, you can override on individual runs or set a different default at any time.
Wear indicator colours
The bar turns orange above 75% and red above 95%. The default replacement threshold is 800 km, which you can adjust per shoe in the shoe's edit screen.
Default shoe
Tap a shoe in the list to open its edit screen, then toggle Default shoe for new runs on. All new runs go to the default shoe unless overridden.
Retiring shoes
Swipe left on an active shoe to retire it. Retired shoes stop accumulating mileage and move to the Retired section. All their history stays attached — runs keep the shoe link.
Analytics
Activity dashboard
The Activity tab gives you a complete picture of your training history — weekly mileage over the last 12 weeks, pace trends, a training calendar showing run intensity by day, and your personal records all in one place.
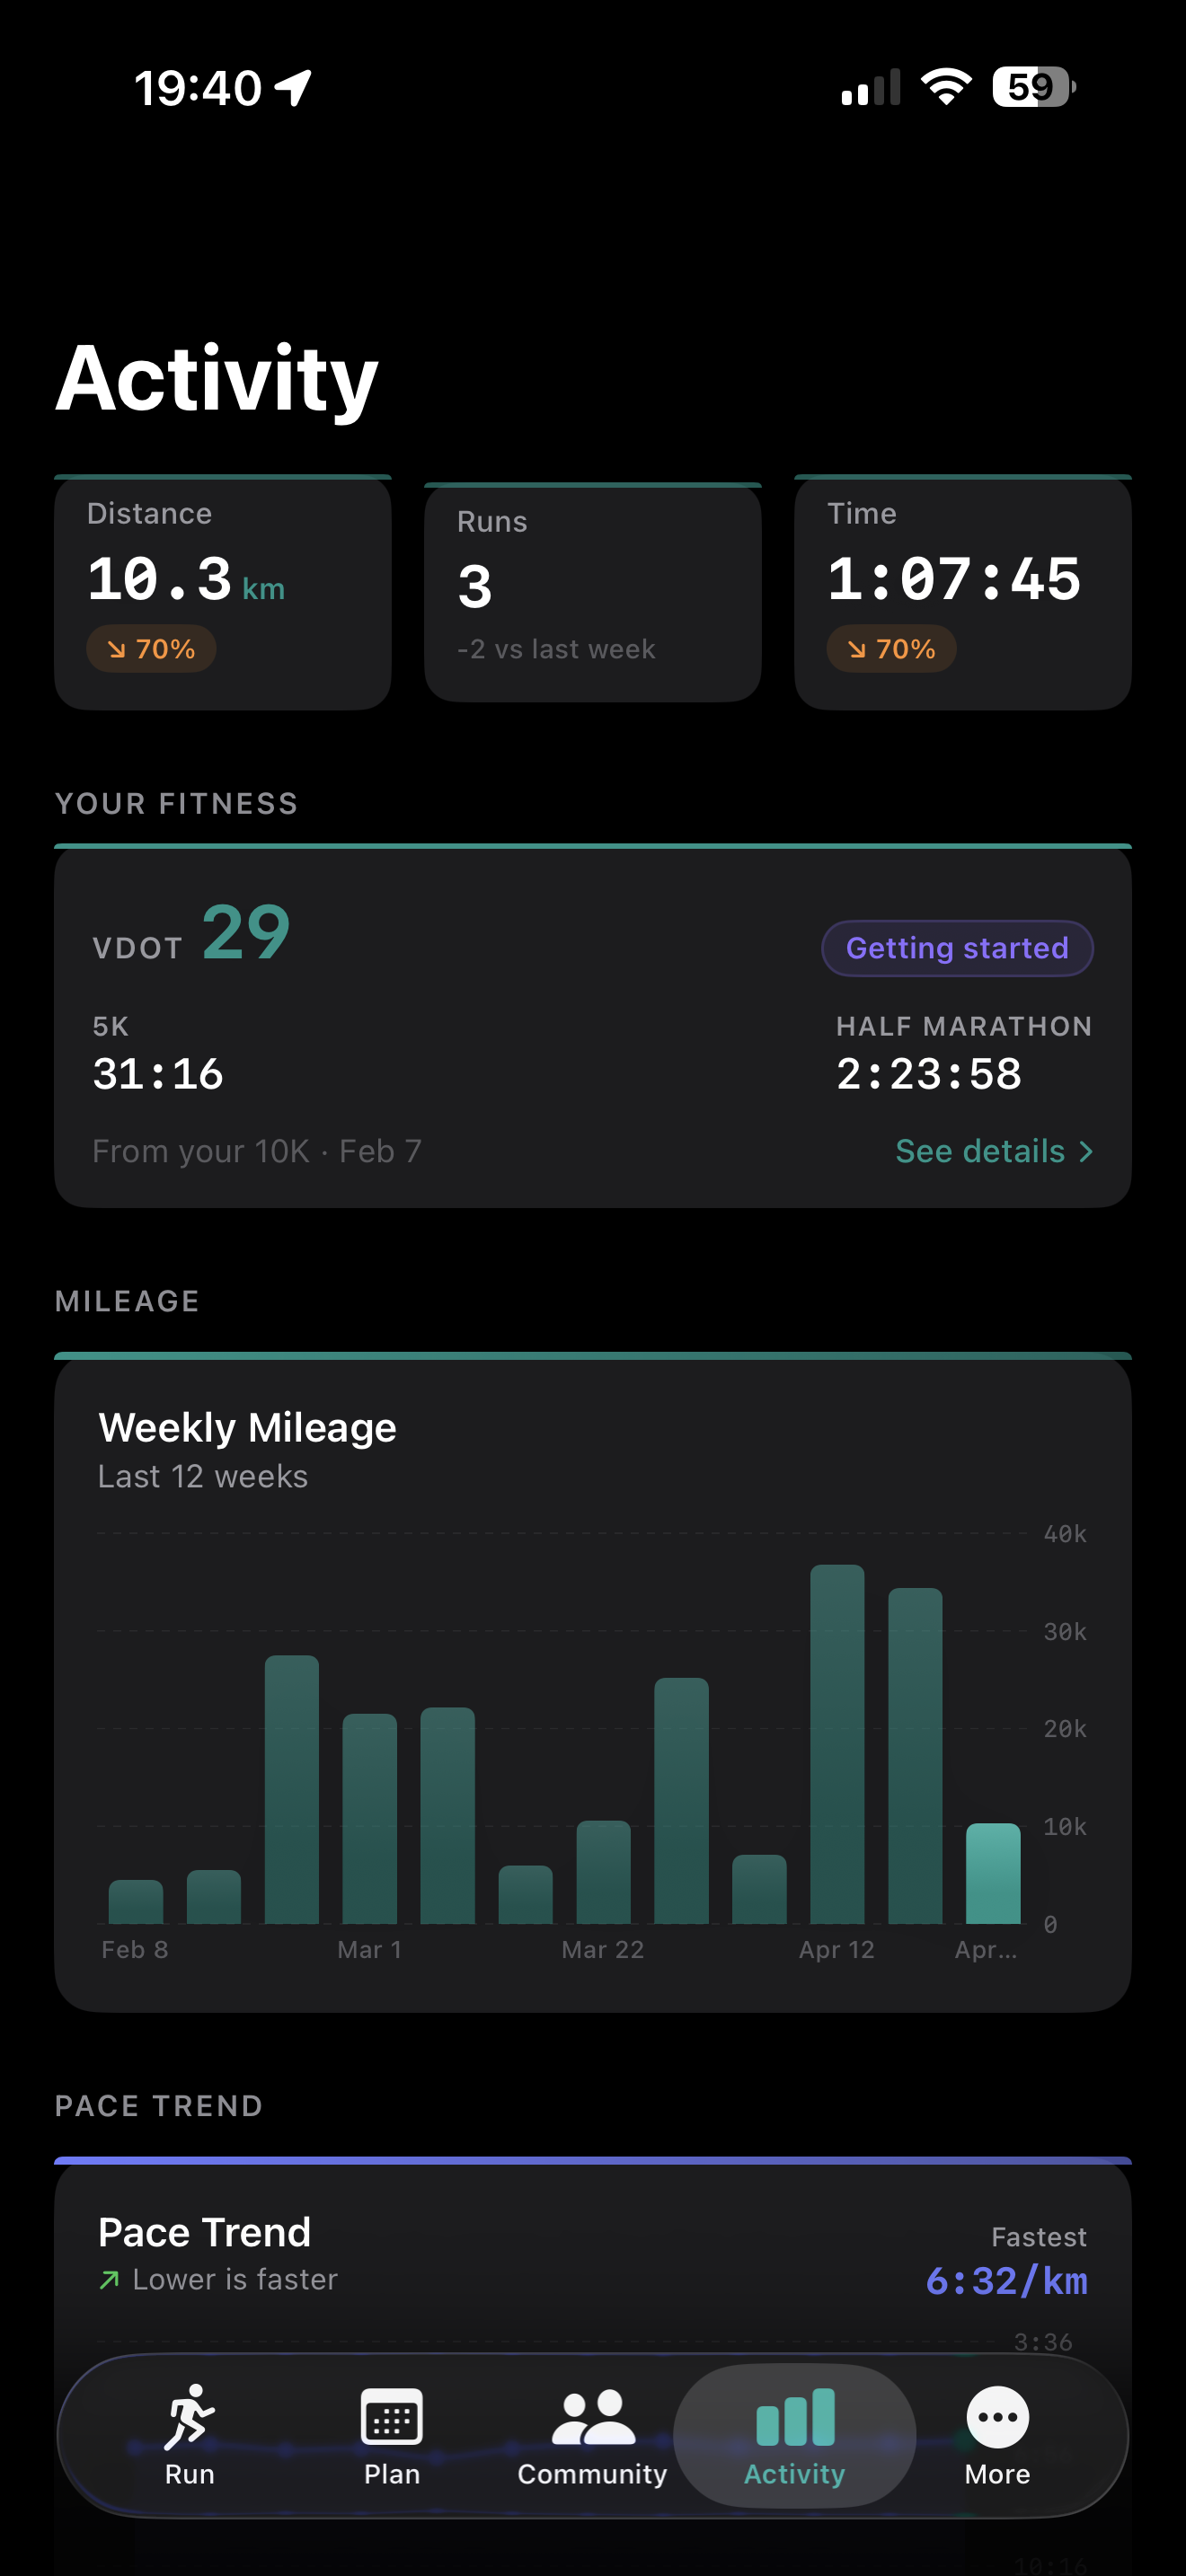
Mileage chart
Weekly total distance for the last 12 weeks as a bar chart. Shows your training load trend at a glance. Tap or drag across the chart to highlight a week and see its exact total.
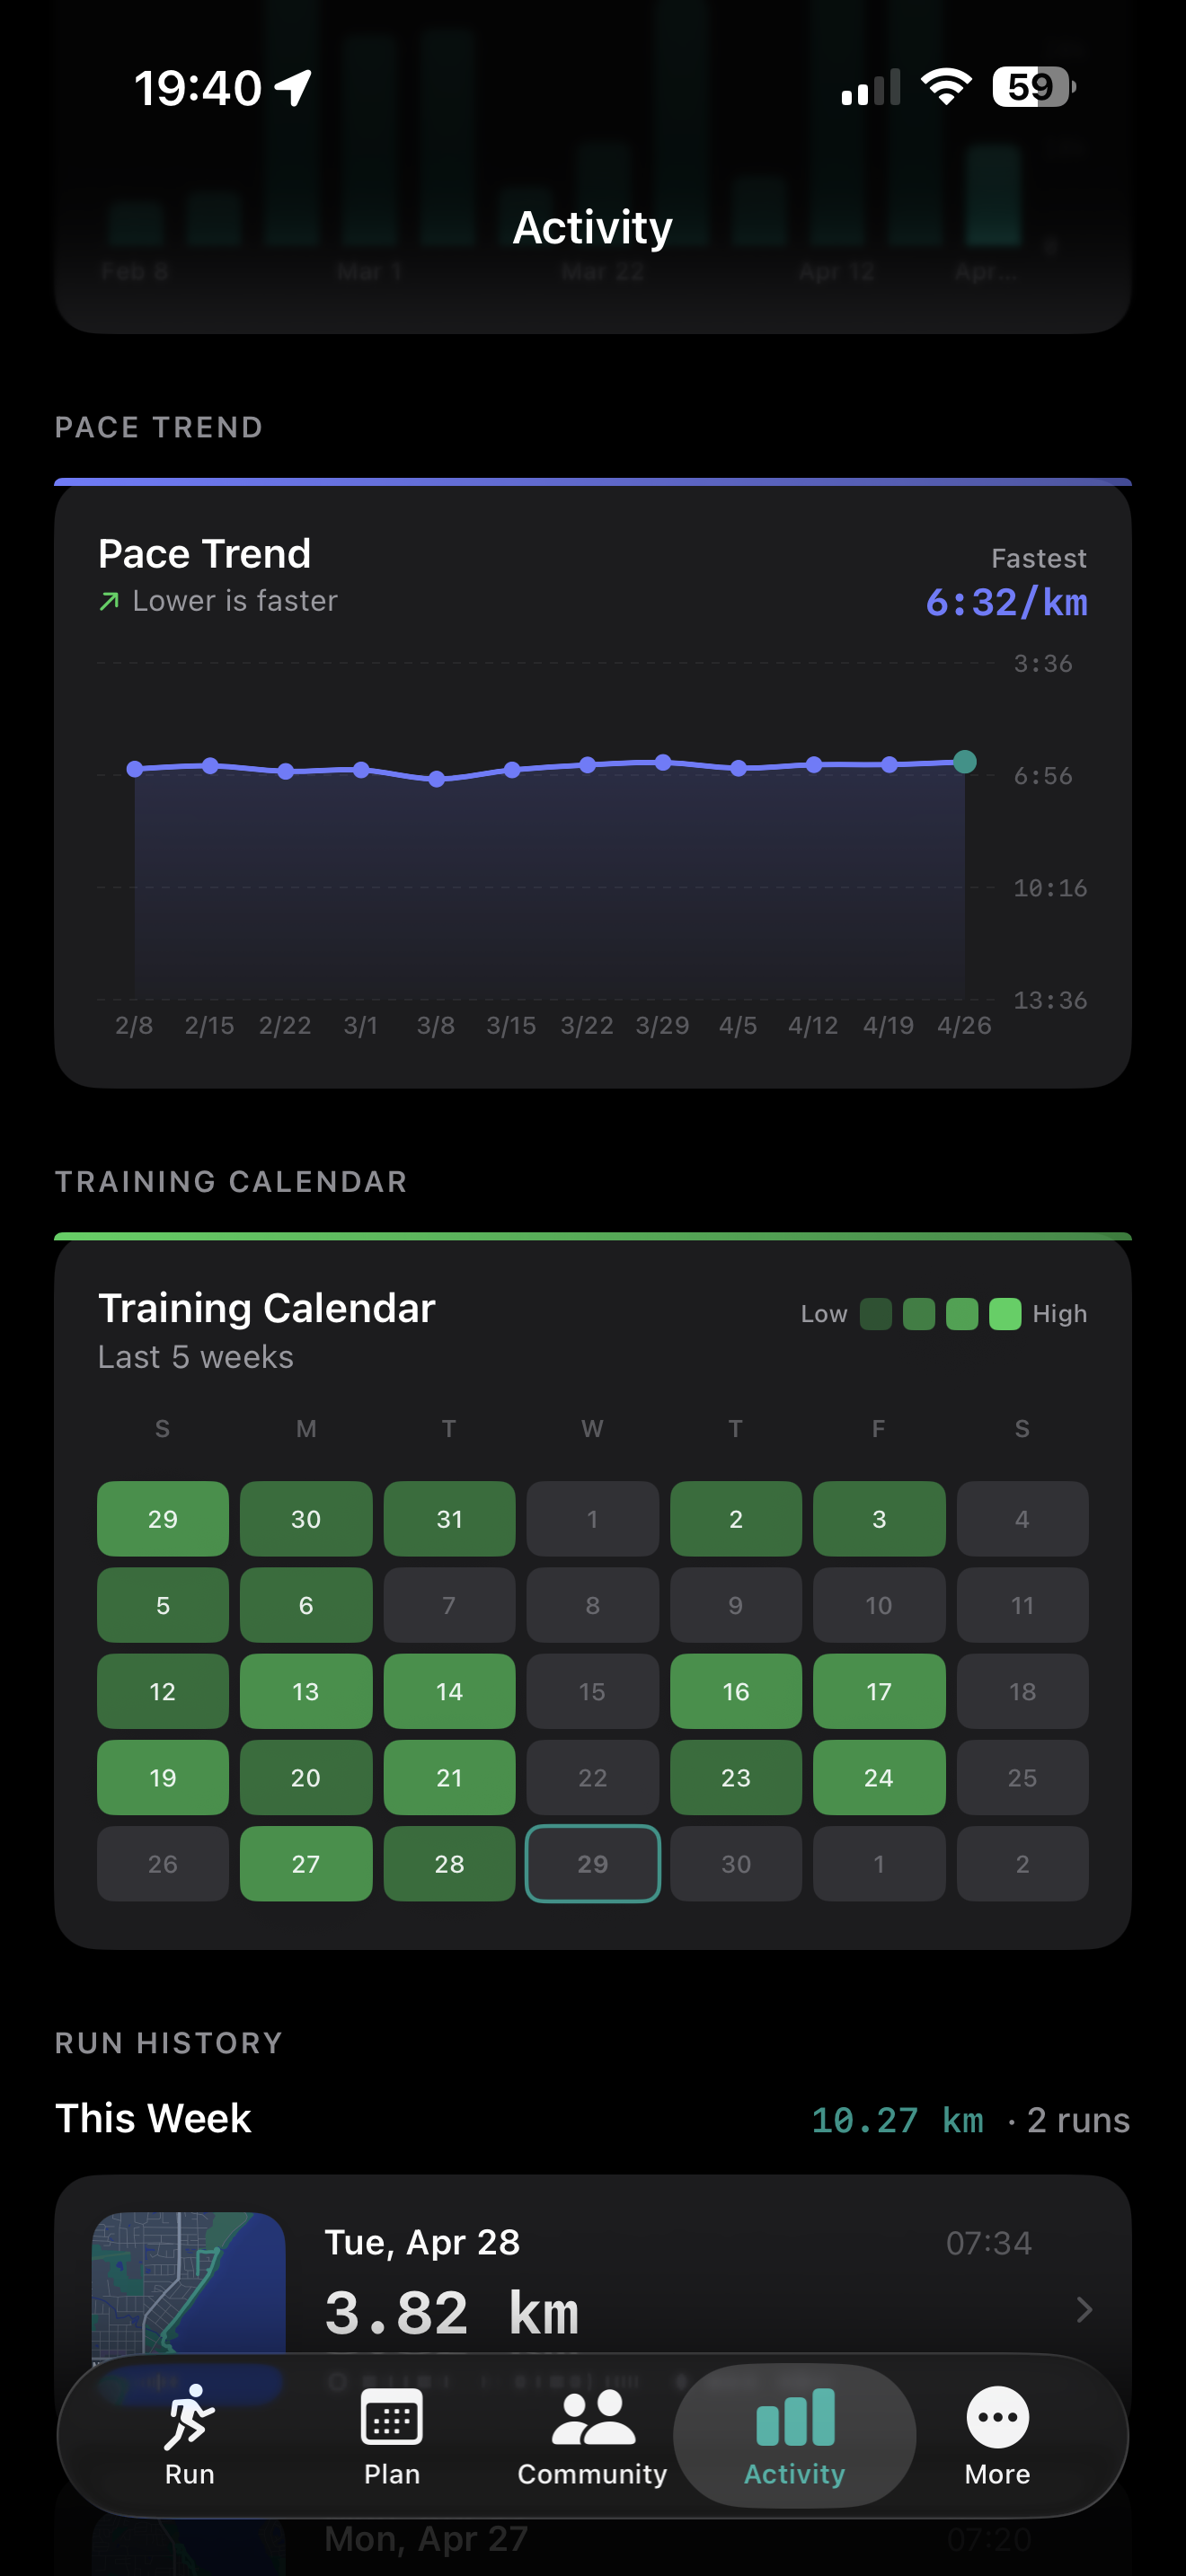
Pace trend
Your average pace per run over the last 12 weeks as a line chart. A downward trend (faster pace) alongside stable or increasing volume is a good sign of improving fitness.
Training calendar
A 5-week calendar grid with colour intensity showing your training load by day — light green for easy efforts through dark green for hard days. Useful for spotting rest-day patterns and planning recovery.
Continue reading